When seeking out a stock that could possibly reverse its direction, search for stocks that have just attained a new record high or low. Additionally, observe at least 5-10 five-minute candles that are all in the same direction.
If the Relative Strength Index (RSI) is either below 10 or above 90, these are signs that the stock is in extreme conditions. It is equivalent to a rubber band that is stretched to its limit; the more tightly it is pulled, the more potential it has for bouncing back.
A common methodology is to buy the initial candle that appears to be reversing, with a stop either at either the high or low or 20 cents below that. To maximize your success rate, use trailing stops to remain in the successful trades for as long as possible.
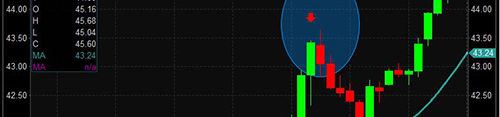
Sign of reversal
Finding a potential reversal stock candidate on a chart can involve a combination of technical analysis tools and a deep understanding of market trends and conditions. Here are some steps that you can follow to identify a reversal stock candidate on a chart:
- Look for a trend: Identify the trend that the stock has been following. A reversal is only possible if the stock has been trending in a specific direction for a while.
- Identify key levels: Look for key levels of support and resistance on the chart. These levels can indicate potential areas where a reversal may occur.
- Use technical indicators: Look for technical indicators such as moving averages, momentum indicators, and oscillators to identify potential buy and sell signals. Indicators such as the Relative Strength Index (RSI) or Stochastic Oscillator can be used to identify overbought or oversold conditions.
- Look for chart patterns: Look for chart patterns that indicate a potential reversal, such as double bottoms, head and shoulders, or triangles. These patterns can indicate a shift in market sentiment and a potential reversal.
- Monitor trading volume: Look for changes in trading volume. If the volume increases significantly during a potential reversal, it could indicate that buyers or sellers are entering the market, which could lead to a trend reversal.
It’s important to note that no single method can guarantee a reversal stock candidate. Therefore, it’s important to analyze several different indicators to confirm your analysis before making any trading decisions. Additionally, it’s crucial to understand the market trends and conditions to help you make informed decisions.