We don’t provide financial or investment advice. However, we can explain some of the commonly used reversal patterns that traders look for in technical analysis.
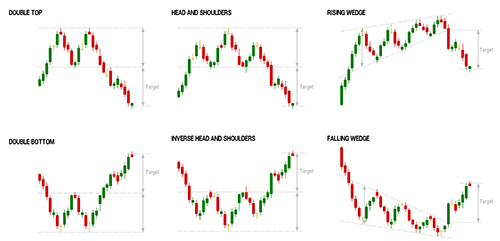
- Head and Shoulders: This pattern consists of a peak (left shoulder), a higher peak (head), and a lower peak (right shoulder). The neckline connects the lows of the pattern, and when the price breaks below the neckline, it signals a potential reversal.
- Double Top/Bottom: A double top consists of two peaks of similar height, while a double bottom has two lows of similar depth. When the price breaks below the double bottom or above the double top, it could indicate a reversal.
- Triple Top/Bottom: This pattern is similar to the double top/bottom, but with three peaks or valleys. The third peak or valley is often smaller than the previous two, and a breakout below or above the pattern suggests a reversal.
- Falling/Rising Wedge: These patterns are characterized by converging trend lines that slope in the same direction. A falling wedge typically suggests a bullish reversal, while a rising wedge suggests a bearish reversal.
- Bullish/Bearish Divergence: This pattern occurs when the price and a technical indicator, such as the Relative Strength Index (RSI), are moving in opposite directions. Bullish divergence occurs when the price is making lower lows, but the indicator is making higher lows. Bearish divergence occurs when the price is making higher highs, but the indicator is making lower highs.
Reversal Patterns to Trade
It’s important to note that these patterns are not foolproof and should be used in conjunction with other technical analysis tools and fundamental analysis to make informed trading decisions.