Reversal candlestick patterns are a type of technical analysis tool used by traders to identify potential trend reversals in financial markets. These patterns are formed by the open, high, low, and close prices of an asset over a given time period, typically represented on a candlestick chart.
There are several types of reversal candlestick patterns, including:
- Hammer: a bullish reversal pattern that forms after a downtrend, with a long lower shadow and a small real body near the top of the candlestick.
- Shooting Star: a bearish reversal pattern that forms after an uptrend, with a long upper shadow and a small real body near the bottom of the candlestick.
- Doji: a neutral reversal pattern that forms when the open and close prices are the same, indicating indecision in the market.
- Evening Star: a bearish reversal pattern that forms after an uptrend, consisting of a large white candlestick, followed by a small candlestick with a gap up, and then a large black candlestick.
- Morning Star: a bullish reversal pattern that forms after a downtrend, consisting of a large black candlestick, followed by a small candlestick with a gap down, and then a large white candlestick.
- Engulfing: a bullish or bearish reversal pattern that forms when the body of one candlestick completely engulfs the body of the previous candlestick.
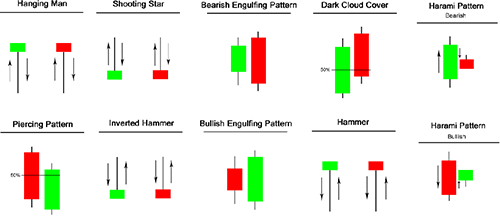
Reversal Candlestick Patterns
Traders use these patterns, along with other technical analysis tools, to help identify potential turning points in the market and to inform their trading decisions. However, it’s important to note that no trading strategy is foolproof, and market conditions can change rapidly, so traders should always exercise caution and use appropriate risk management techniques.