Reversal patterns in stock trading refer to chart patterns that indicate a potential change in the trend of a stock’s price. These patterns can help traders and investors identify possible turning points in the market and make informed decisions about buying or selling.
Here are some of the most common reversal patterns for stocks:
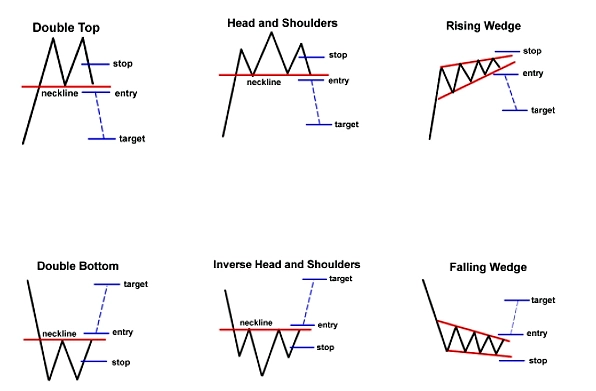
- Head and Shoulders Pattern: This pattern appears when the stock’s price rises to a peak (left shoulder), drops, rises again to a higher peak (head), drops again, and then rises to a lower peak (right shoulder). The neckline is drawn connecting the lows between the shoulders. When the stock price breaks below the neckline, it’s seen as a bearish signal.
- Double Top/Bottom Pattern: A double top pattern is formed when the stock price reaches a high point, drops, then rises again to the same high point before dropping again. A double bottom is the opposite of the double top pattern, where the stock price hits a low point, bounces back up, falls again to the same low point before rebounding. These patterns can indicate that the stock is likely to reverse its current trend.
- Wedge Pattern: A wedge pattern appears when the stock price consolidates between two converging trendlines. A rising wedge pattern occurs when the trendline for the highs is steeper than the trendline for the lows, indicating a potential reversal to the downside. A falling wedge pattern is the opposite and can indicate a potential reversal to the upside.
- Island Reversal Pattern: This pattern appears when the stock price gaps up or down, then consolidates for a period of time before gapping in the opposite direction. This pattern can indicate a potential reversal in the stock’s trend.

Reversal Patterns for Stocks
It’s important to note that these patterns are not always reliable and should be used in combination with other technical and fundamental analysis tools. Additionally, traders should always practice risk management and use stop-loss orders to minimize potential losses.
Last Updated on February 25, 2023 by ingmin
