A reversal candle on a forex chart is a type of candlestick pattern that suggests a potential trend reversal. It is formed when the price of a currency pair moves in one direction (up or down) for a period of time, but then the direction of the price movement changes dramatically in the opposite direction. The reversal candle has a long wick or tail on one side and a small body on the other side.
The reversal Forex candle patterns are those that follow a price movement and have the capability to change the direction of the price activity. These reversal candle pattern indicators are more common than the continuation candle pattern indicators which can be seen on the Japanese candle stick charts.
For example, a bullish reversal candle would have a long tail below the body, indicating that the price fell significantly before buyers stepped in and pushed the price back up. Similarly, a bearish reversal candle would have a long tail above the body, indicating that the price rose significantly before sellers stepped in and pushed the price back down.
Reversal candles can be useful for traders who are looking to identify potential trend reversals and adjust their trading strategies accordingly. However, it’s important to note that not all reversal candles lead to actual trend reversals, so it’s important to use other technical analysis tools and indicators to confirm the potential reversal.
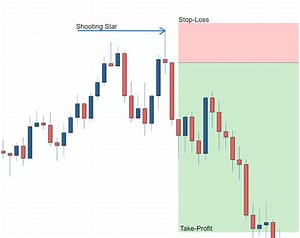
Reversal Candles On a Chart