A reversal head and shoulders pattern is a technical analysis pattern that appears on a price chart of a security (such as a stock, currency pair, or commodity). It is considered to be a bullish reversal pattern, meaning that it suggests a potential shift from a downtrend to an uptrend.
The pattern consists of three peaks, with the middle peak being the highest (the “head”) and the two outside peaks being slightly lower (the “shoulders”). The pattern is completed when the price breaks through a “neckline” level that connects the lows between the shoulders.
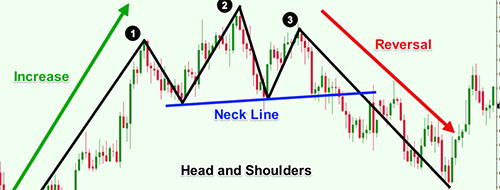
Head and Shoulders Reversal Chart Pattern
Traders look for this pattern as it can be an indication of a change in trend from bearish to bullish. The pattern is believed to indicate that the bears (sellers) are losing control and that the bulls (buyers) are starting to take over.
It is important to note that not all head and shoulders patterns are reversal patterns, as there are also continuation patterns. It’s important to also confirm the pattern with other technical indicators before taking a trade.
Also – a reverse head and shoulders pattern is a short-term indicator of a bullish trend reversal at the bottom of the market. This pattern is depicted by three consecutive lows on a price chart, with the middle trough being the lowest of the three and forming the shape of a head and two shoulders.