A reversal wedge pattern is a technical analysis chart pattern that can appear in the stock market or any financial market chart. It is formed when the price of a stock trades within two converging trend lines that are sloping in the opposite direction.
Reversal Wedge Pattern
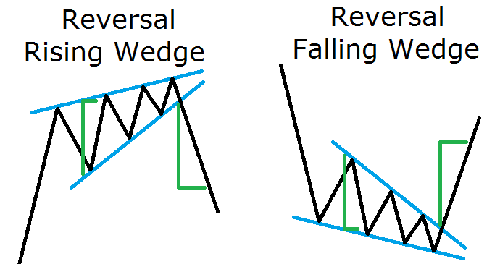
There are two types of reversal wedge patterns: the rising wedge and the falling wedge.
- A rising wedge is a bearish pattern that typically forms during an uptrend. The upper trendline of the wedge is sloping upwards, while the lower trendline is sloping upwards at a steeper angle. This suggests that the bullish momentum is weakening and a trend reversal could be imminent.
- A falling wedge is a bullish pattern that typically forms during a downtrend. The upper trendline of the wedge is sloping downwards, while the lower trendline is sloping downwards at a shallower angle. This suggests that the bearish momentum is weakening and a trend reversal could be imminent.
Traders and investors use reversal wedge patterns to identify potential trend reversals, entry and exit points, and to manage risk by setting stop-loss orders. However, it’s important to note that like all technical analysis indicators, the reversal wedge pattern is not a guaranteed signal and should be used in conjunction with other analysis tools and fundamental analysis.